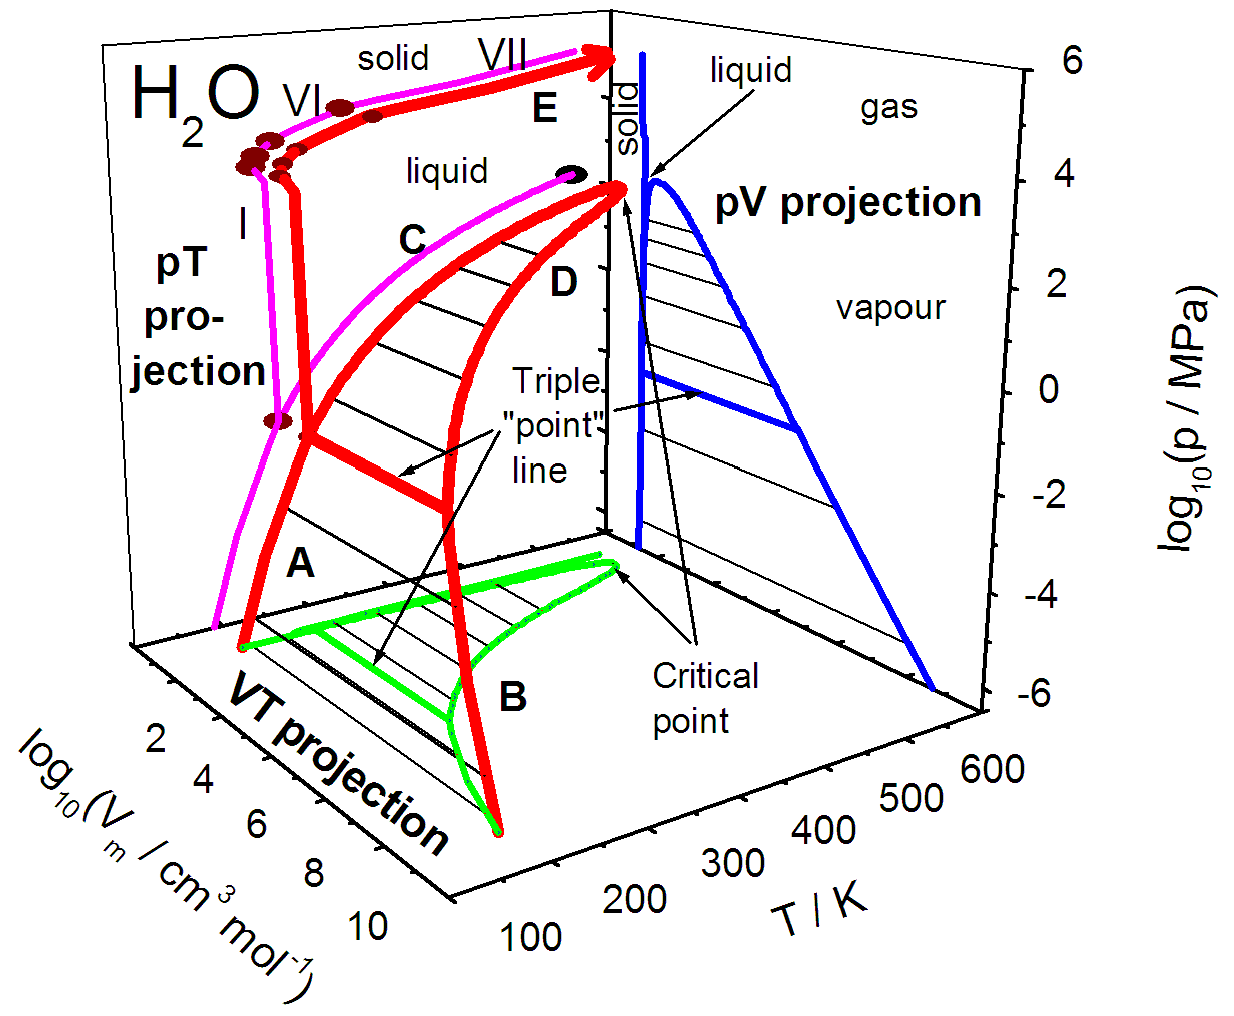
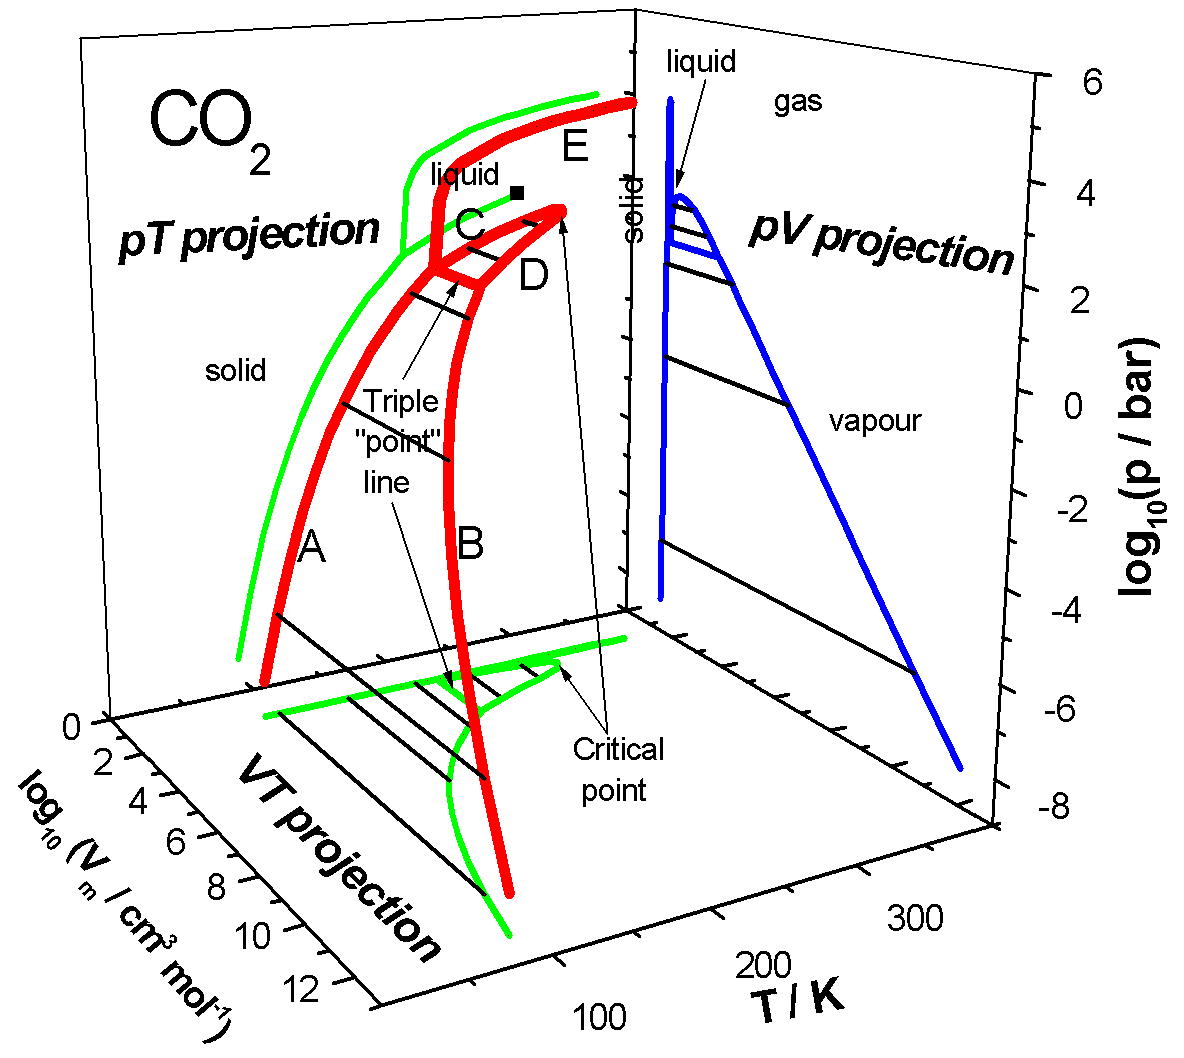
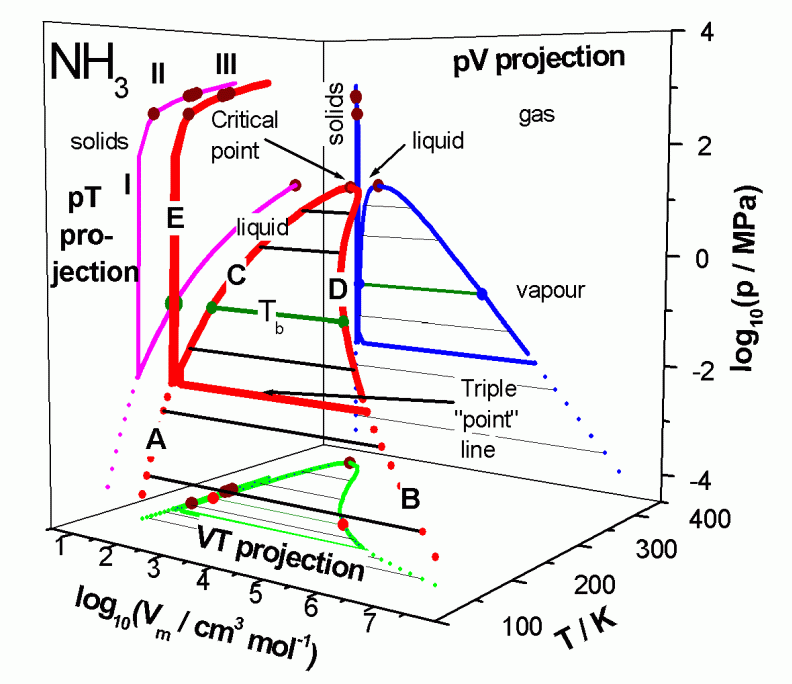
Phase diagram for
The graph on the right is interactive; use your mouse on it
(instructions).
Don't you see the interactive graph? See
configuration.
Rotate by dragging the mouse.
Zoom by rolling the mouse wheel, or holding [Shift] and dragging vertically.
Translate by holding [Ctrl] and dragging with the right button.
More help for using the mouse in Jmol.
Zoom by rolling the mouse wheel, or holding [Shift] and dragging vertically.
Translate by holding [Ctrl] and dragging with the right button.
More help for using the mouse in Jmol.
By default, a Java applet is used in computers, and that may be blocked by security or not installed.
You can choose the alternative non-Java software (somewhat slower in response).
Use Java
Avoid Java
 Figure 2 from
Water, water, everywhere: Phase diagrams of ordinary water substance. L. Glasser (2004) J. Chem. Educ. 81: 414-418.
|
p = pressure
Vm = molar volume T = absolute temperature |
How to cite:
To cite this material, please use this publication:
Interactive 3D phase diagrams using Jmol. A. Herráez, R.M. Hanson and L. Glasser (2009) J. Chem. Educ. 86: 566
and this url: http://biomodel.uah.es/Jmol/plots/phase-diagrams/
 Figure 3 from
 Figure 1 from