toggle sound

This simulation was originally developed as a Java applet by David Mix under supervision of Dr. Paul Craig (Rochester Institute of Technology; Rochester, NY, U.S.A.)
Conversion to this HTML5 version (which does not require Java) was done by Dr. Robert M. Hanson (St Olaf College, Northfield, MN, U.S.A.) using the SwingJS tool.
Duplicated, adapted and translated with permission from Dr. Craig
This is System.out. clear it

Add ?j2snocore to URL to see full class list; ?j2sdebug to use uncompressed j2s/core files
get _j2sClassList.txt

Presentation and brief instructions

This application simulates the process of electrophoresis of proteins on a polyacrylamide gel with SDS. After separation, you can obtain a graphical plot with results. On such plot you may determine the experimental molecular mass of the samples from their mobility compared to that of the standards.

Briefly:

  1. Choose a speed for the animation (this will depend on your computer)
  2. Choose a sample (Unknowns # 1 to 10).
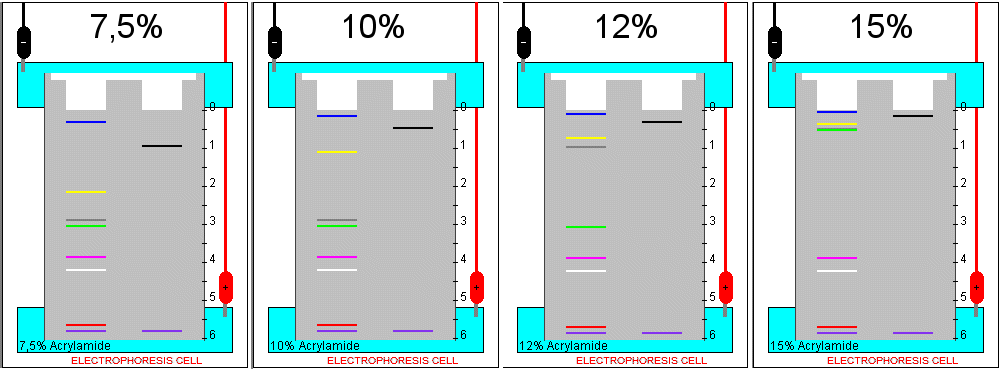
  3. Choose an acrylamide concentration for the gel (between 7.5% and 15%).
  4. Choose 2 or more standards, ticking the checkboxes by their name. You may consult their identity and properties clicking on the Proteín info button.
  5. Choose a voltage.
  6. Press the Add Standard button to load the standards in the first well.
  7. Press the Add Sample button to load the unknown samples in the second well.
  8. Press the Start button to switch current on and start the electrophoresis. Before the bands exit the lower end of the gel, press theStop button to switch the current off.  

We seek collaborators:
to make profit of this simulator, it would be interesting to have practice exercises or protocols that use it; verified data for other proteins are also welcome.

Detailed instructions

General controls:

Set parameters Displays on the left pane the controls to set parameters.
Plot results Displays on the left pane the graph of mobility against size.
Simulation Displays on the right pane the simulated gel.
Protein info Displays on the right pane detailed information about the proteins.

Procedure:

1. Choose an animation speed (so it is comfortably displayed in whatever computer your are using)
2. Choose an unknown sample
3. Choose an acrylamide concentration for the gel
4. Choose 2 or more standards, ticking the checkboxes by their name. You may check their identity and properties pressing the 'Protein Info' button.
5. Choose a voltage
Add Standard 6. Press the button to load standards into the first well.
Add Sample 7. Press the button to load samples into the second well.
Start Stop 8. Press the buttons to switch current on and start running the electrophoresis, and to switch if off before bands exit the lower end of the gel.

Definition of terms

Acrylamide
The main momomer composing polyacrylamide.
Agarose
A polymer that forms a gel with fairly large pores. It is used as the separation medium in electrophoresis of macromolecules, particularly nucleic acids.
Anode
Positive electrode (to which anions, negatively charged, move).
Bisacrylamide
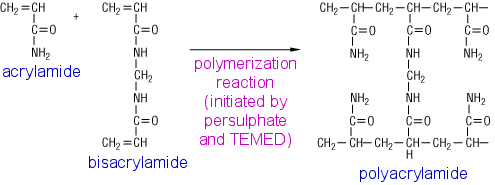
 The common name for N,N'-methylenebis(acrylamide), a monomer composing polyacrylamide.
Buffer
.
Capillary electrophoresis
.
Catode
Negative electrode (to which cations, positively charged, move).
Convection currents
.
Denaturing agent
A chemical or a physical condition that provoke denaturation of macromolecules.
DTT
Dithiothreitol
threo-2,3-dihydroxy-1,4-butanedithiol. Also known as Cleland's reagent.
See reducing agents.
Reduction reaction of disulphides:
 
Electroosmotic flow
.
Electrophoresis
The separation of molecules in solution by application of an electrical field. Depending on the support used, molecules will separate as a function of a combination of their electrical charge, their size and their shape.
 
Electrophoretic flow
.
Mercaptoethanol
More properly, beta-mercaptoethanol or 2-mercaptoethanol. See reducing agents.
Molecular mass
The mass of a molecule. It is usually stated without units, referred to the atomic mass unit (a.m.u. or dalton, Da), therefore it is more correct saying relative molecular mass (Mr). The term molecular weight is less correct. In the case of macromolecules, particularly proteins, it is common to use molecular mass divided by one thousand, so expressed as kilodaltons (kDa). Finally, the amount of substance the mass of which is, in grams, numerically equivalent to Mr corresponds to one mole of the substance.
Examples:
Molecular mass of anhydrous copper sulphate (CuSO4) is 159.6 amu = 159.6 Da, or its relative molecular mass is Mr = 159.6. Its molar mass is 159.6 g/mol
Molecular mass of myoglobin is 17183 Da = 17.2 kDa; its relative molecular mass is Mr = 17183. Its molar mass is 17183 g/mol
Native
.
 
Polyacrylamide
A polymer generated from acrylamide and bisacrylamide. It forms a gel with pores smaller than those in agarose gels. It is used as the separating medium in electrophoresis of macromolecules, particularly proteins and nucleic acid fragments.
Primary structure
.
 
Random coil
.
Reducing agents
Chemicals able to reduce disuphide bonds in proteins (-S-S-) to sulphydryl groups (-SH). They allow to completely unfold a protein and to separate the subunits in a multimeric protein; both effects are needed so that the mobility of the protein in SDS-PAGE electrophoresis will be according to its molecular mass. The most common are beta-mercaptoethanol and dihtiothreitol (DTT).
Relative migration
.
Rm
Relative mobility or relative migration.
Quaternary structure
.
Secondary structure
.
Tertiary structure
.
 
SDS
 
Sodium dodecylsulphate
A chemical with properties as detergent, commonly used in electrophoresis (the SDS-PAGE technique) due to its ability to denature proteins , binding them in a constant mass ratio. As a result, protein molecules are fully unfolded and covered up with a uniform negative charge; due to this, their electrophoretic mobility is inversely proportional to the number of their amino acid residues.
Other names: SDS, sodium laurylsulphate.
SDS-PAGE
Sodium Dodecyl Sulphate - PolyAcrylamide Gel Electrophoresis. The detergent SDS is included both in the composition of the gel and of the electrophoresis buffer, typically at a 1% concentration. The main use for this technique is estimation of molecular mass of proteins.
Subunits
.
 

Analysis of results

  1. Clicking on each protein band in the gel will display at the top their informaction. Take note of the relative mobility for the band of the unknown protein sample. To estimate the molecular mass of the unknown protein:
  2. Press the Plot results button to display the calibration graph.
  3. On that plot, position the mouse pointer over the abscissa axis; when the value displayed matches the mobility of the unknown protein (that you wrote down before), press the mouse button. An interpolation line will be plotted and you may read by the ordinates axis the value of the logarithm of molecular mass, and at the top that mass.

Practice exercises

A) Influence of the applied voltage

Load the gel with all standards and any one of the unknown protein samples.

Choose in turn each of the voltages available in the simulator and run the electrophoresis until the tracking dye band (purple colour) approaches the lower end of the gel. Write down in each case the mobility of the standards.

1. Which is the effect of an increase in the voltage applied between both electrodes?

the standards separate better
the standards separate worse
the standards move faster
the standards move slower
 

Don't you understand why your answer is not correct?
Check the

B) Influence of the acrylamide concentration

Load the gel with all standards and any one of the unknown protein samples.

Choose in turn each of the acrylamide concentrations available in the simulator and run the electrophoresis until the tracking dye band (purple colour) approaches the lower end of the gel. Write down in each case the mobility of the standards.

1. Which is the effect of an increase in the acrylamide concentration that forms the gel?

the standards separate better
the standards separate worse
the standards move faster
the standards move slower
 

Don't you understand why your answer is not correct?
Check the

2. How can you interpret this result, in terms of the mechanism of separation?

Acrylamide binds the proteins and slows their progress down; this effect is stronger when the acrylamide concentration is higher.
Acrylamide binds the proteins and increases their charge, so they move faster; this effect is stronger when the acrylamide concentration is higher.
A higher acrylamide concentration produces a gel with smaller pores, so proteins move more slowly.
A higher acrylamide concentration produces larger size of polyacrylamide chains, which favours progress of proteins.
 

C) Self-assessment of results for molecular mass

Choose one of the unknown protein samples, included in the simulator.

Load that sample in the gel, as well as all the standards.

Run the electrophoresis until the band of the tracking dye (purple colour) approaches the lower end of the gel.

Once finished, measure the mobility of the unknown protein and interpolate that value in the graph, to obtain the relative molecular mass.

To confirm that your results are correct:

  type here your result for the relative molecular mass
Unknown sample # 1
Mr =    
Unknown sample # 2
Mr =    
Unknown sample # 3
Mr =    
Unknown sample # 4
Mr =    
Unknown sample # 5
Mr =    
Unknown sample # 6
Mr =    
Unknown sample # 7
Mr =    
Unknown sample # 8
Mr =    
Unknown sample # 9
Mr =    
Unknown sample # 10  
Mr =    

D) Determination of quaternary structure

Load the gel in the simulator with all the standards and any one of the unknown protein samples (although you will not use the latter).

Run the electrophoresis until the band of the tracking dye (purple colour) approaches the lower end of the gel.

Once finished, access the graph of relative molecular mass against mobility and solve the following problems:

1. An enzyme is treated with SDS and beta-mercaptoethanol and analysed on a polyacrylamide gel with SDS; two bands are observed with relative mobilities of 0.47 and 0.59.
Thanks to some independent experiments involving size exclusion chromatography and ultracentrifugation, the molecular mass of this enzyme has been determined as 128 000.
Using the calibration line obtained in the simulator, estimate the molecular mass of both subunits of the enzyme and deduce which its quaternary structure is.

Smaller subunit (A): Mr =    
Larger subunit (B): Mr =    

Quaternary structure:                     
   

2. A protein treated with SDS but without beta-mercaptoethanol is analysed on a polyacrylamide gel with SDS, showing a single band with relative mobility of 0.21.
When the same protein is previously treated with SDS and beta-mercaptoethanol, electrophoresis displays two bands, with mobilities 0.48 and 0.61.
Using the calibration line obtained in the simulator, interpret the results.

3. (Advanced) If the protein is previously treated with trypsin, the same band is obtained in the absence of beta-mercaptoethanol, but four bands in its presence. Explain these results.

Angel Herráez. Part of the website Biomodel.uah.es ❖ Esta página está disponible también en español.