
Chromatogram:

absorbance
elution time or volume
pH
8
6
 Absorbance detector
Absorbance detector
Absorbance detectorThe matrix that fills the column is a cationic exchange resin (small particles of an inert polymer with functional groups that are negatively ionised at the pH of the elution buffer).
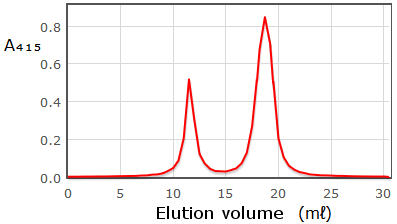
This simulation displays the separation process of the two components in the sample, which have a different retention on the chromatographic matrix (their molecules symbolised by coloured circles). These components are glycated haemoglobin (HbA1c) and unmodified haemoglobin (HbA). Due to the small difference in electric charge between both, their interaction with the matrix has different strength, so they advance with different speed and it is possible to achieve their separation by using suitable buffers for elution.
Specifically, the simulation presents the gradual mixing of two buffers, resulting in a pH gradient. It would also be possible to use an ionic-strength gradient or even with a buffer that had a precise pH in between the two isoelectric points of both proteins. Detection is achieved measuring the absorbance of the effluent, the liquid that exits the column, since haemoglobin presents absorbance maxima at 415 nm and 540 nm.
Pay attention to how, in addition to get separated while progressing through the column, both proteins disperse, leading to widening of the bands. This is simply a result of diffusion of the molecules.
You may change the speed of progress: to observe better.
To start, click on one of the syringes (both hold different samples).
By integration of the two peaks (i.e., measuring their areas separately) we can calculate the abundance of haemoglobin A1c, as a percentage of the total amount of haemoglobin (HbA + HbA1c). Since absorbance is proportional to concentration, the area under its curve is proportional to mass. Why?
After saving to an image the chromatograms obtained with the 2 samples, it is possible to measure their areas by following these instructions.
In a real laboratory, we can also calculate by collecting the effluent leaving the column into a series of tubes, combining fractions corresponding to each peak and measuring their absorbance.
Why "glycated" and not "glycosylated" or "glucosylated"?
![]() Offered to be used under the terms of Creative Commons Attribution NonCommercial ShareAlike License.
Offered to be used under the terms of Creative Commons Attribution NonCommercial ShareAlike License.
Programmed in HTML5, CSS and JavaScript and foreseeably compatible with all types of web browsers, operating systems and devices. Uses features of the TinyBox library.
Animation inside the column is based on a Java animation by Henry R. Bungay; Dept. Chemical Engineering, Rensselaer Polytechnic Institute, Troy, NY, USA.
Position of the peaks in the chromatogram and design of the pH gradient are neither exact nor matching experimental data, but are inspired on Nakatani et al. (1991) doi:10.1007/BF02262397