First of all, a warning: the simulator has a reasonable scientific basis, but it is empirically adjusted to resemble some real profiles I had access to. Since its purpose is illustrative, I have not intended it to be very accurate (which, in addition, is really hard since the details available for this technique are scarce).
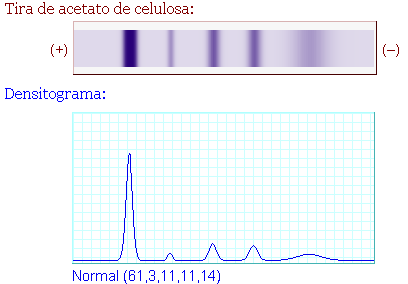
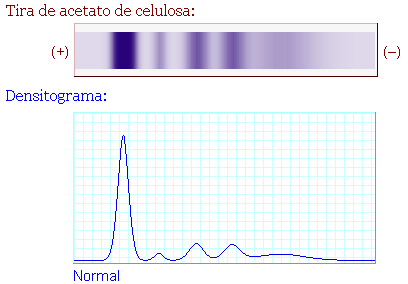
The profile is made by adding up the individual curves for the 5 peaks of protein fractions (albumin and globulins alpha1, alpha2, beta and gamma, or the 5 LDH isoenzymes).
The shape of the individual peaks is achieved using a modified gaussian function, where the exponent is 1.8 rather than 2. This gives somewhat sharper peaks than the standard gaussian.
(I have lost the referece where I got this from. Other options ready to be used are the standard gaussian and a lorentzian, but this is the one that yields best result.)
y = a × exp( −0.5 × | (x − x0) / b |c )
It is construed that peak area must be proportional to the abundance of the respective protein fraction. The area is calculated as the product (peak height) × (peak width at half the height) —which is strictly correct for the normal gaussian.
The parameters used in the function are:
| Albumin | alpha1 | alpha2 | beta | gamma |
| 0.186 | 0.321 | 0.464 | 0.600 | 0.786 |
| LDH-1 | LDH-2 | LDH-3 | LDH-4 | LDH-5 |
| 0.219 | 0.344 | 0.469 | 0.594 | 0.719 |
| Albumin | alpha1 | alpha2 | beta | gamma |
| 12 | 10 | 16 | 18 | 54 |
| LDH-1 | LDH-2 | LDH-3 | LDH-4 | LDH-5 |
| 3.9 | 3.9 | 3.9 | 3.9 | 3.9 |
All this provides a normal profile visually similar to the real profile that I had available.
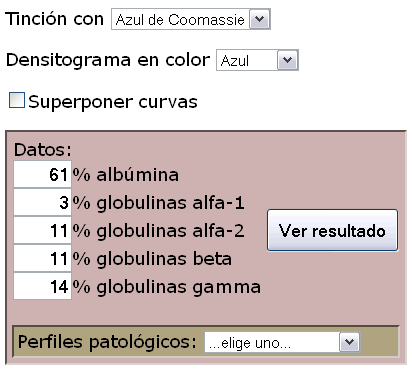
Regarding the colour of the 'staining', I followed a visually attractive method, but again with a mathematical basis:
Colour is calculated for each horizontal position in the strip, from the height calculated in the densitogram:
1. Heigth at that position is made relative (in a 0--1 range) to the maximum in the graph.
 2. A correcting function is applied that reinforces medium and low intensities more than high intensities. (I don't remember the reason for this, but it looked necessary for a better look.) It is a convex function (see the figure):
colour intensity = exp(8*(Max.Int. − Intensity) +1) / exp(8+1)
(I guess I adjusted that empirically)
3. The corrected intensity is multiplied by the maximum value of colour (separately for the three RGB components), which I define empirically to simulate the different staining methods. The mathematically cleanest one is 'autoradiography' which is based on pure black.
JavaScript graphic libraries by Walter Zorn are used to achieve both plots: the drawing of the densitogram and the simulated stained strip.
All the calculation needed for building the graphs (above described) is done using JavaScript.
September 2013: version 2.1:
in Spanish only:
October 2009: version 2.0:
January 2008: small fixes, version 1.1
May 2007: first release, version 1.0
| v. 1.1 | v. 2.0 |
| Plasma proteins | Serum proteins |
 |
 |
 |
 |
Angel Herráez. Part of the Biomodel.uah.es website